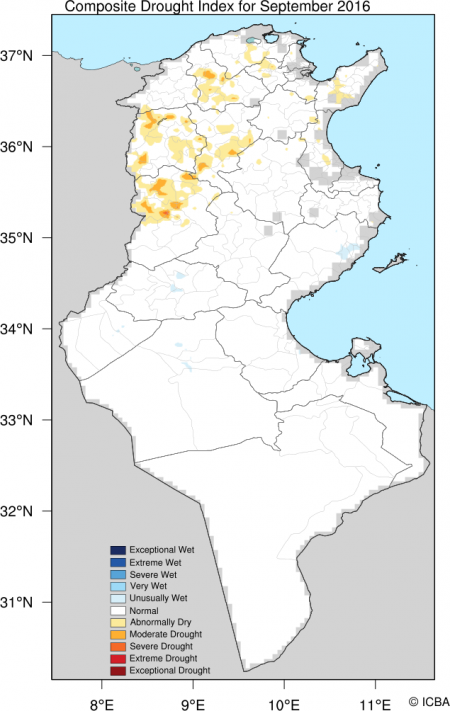
This month’s drought map for Tunisia
A monthly map based on a Composite Drought Index (CDI ) is generated to show the areas under various degrees of drought relative to the average monthly conditions at the country and MENA region level. It considers the causative variables of multi drought forms (mainly meteorological and agricultural). The resulting map is formed by integrating several remotely sensed data sets from NASA, NOAA and other U.S. agencies and modeled data sets in ICBA into a composite drought index. The exact weightings of the different data set input to the CDI have been discussed and agreed for each country, reflecting the varying nature of drought across the region.
Click on the link to find out How the drought map was generated


